The European Social Survey (ESS) conducted between 2002 and 2023 across eleven waves, explored native-born Europeans’ perceptions of immigration. Respondents expressed their opinions on the impact of immigrants in three key areas: economic effects, cultural life, and general perceptions. Additionally, participants were asked about their preferences regarding the number of immigrants allowed into their countries, considering different categories of immigrants. This descriptive analysis delves into the survey findings.
Summary
- Amid a secular growing acceptance of migration, the latest ESS wave shows stable, or slightly worsening, attitudes toward migration in some countries/demographic groups.
- After peaking at 37% in 2020, up from 24% in 2002, the share of EU native-born individuals who believe immigrants improve their country declined slightly to 36% in 2023.
- The proportion of those who think that some or many immigrants should be allowed to come and live in their country declined by 2–3 p.p. between 2020 and 2023, depending on the immigrant group.
- Positive perceptions of the economic impact of immigration remained steady at 47% in the last survey wave, but country-level changes varied, e.g., Ireland (-8%) vs. Sweden (+16%).
- People with tertiary education are more likely to view immigration positively. The recent slight decrease in acceptance of migrants is primarily driven by natives without tertiary education.
- Individuals under 25 consistently hold more positive views on immigrants’ contributions to their country and show greater acceptance of migration compared to older generations. The recent overall decline in acceptance of migrants is primarily driven by people over 25.
- Sweden, Norway, Iceland, and Belgium had the highest acceptance rates for immigrants of different races in 2023, while Greece, Hungary, and Slovakia had the lowest.
Perceptions of the Impact of immigration on host countries
From 2002 to 2023, the order of perceptions regarding the impact of immigration remained consistent in the EU: the belief that immigrants enrich cultural life ranked highest, followed by perceptions of economic benefits, and lastly, the view that immigrants make the country a better place to live. Between 2002 and 2020, the perception of economic benefits saw the largest improvement, increasing by 13.9 percentage points, followed by the belief that immigrants make the country a better place to live (up 12.1 percentage points). The view that immigrants enrich cultural life experienced the smallest increase, at 3.3 percentage points. From 2020 to 2023, positive opinions slightly declined for cultural and general perceptions, while views on economic benefits remained steady (Figure 1).
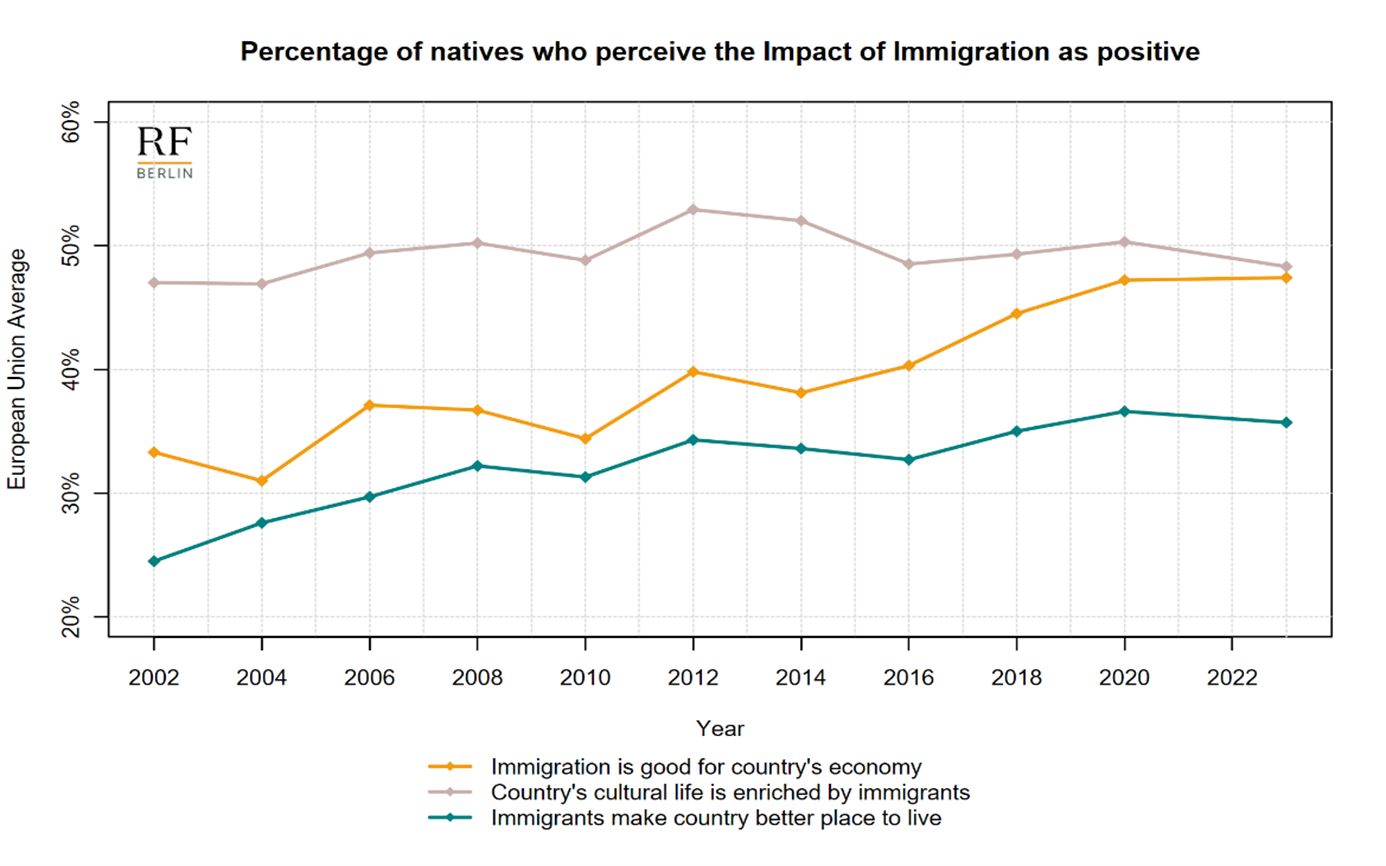
Notes: In the survey, responses to all questions about immigrants’ impact were rated from 0 to 10, with 0 indicating bad/undermined/worse and 10 indicating good/enriched/better. For this figure, individual responses from 6 to 10 were aggregated and labelled as good/enriched/better. A ‘don’t know’ option was also available as an answer. European Union includes all 27 European Member States as of February 1st, 2020.
In 2023, perceptions of immigration’s economic impact varied significantly across Europe. Natives in Iceland, Finland, Switzerland, and the UK expressed the most positive views, while those in Greece, Hungary, and Slovakia held the least favorable opinions. Across the European Union, the belief that immigration benefits the economy remained stable at 47%, unchanged since 2020. However, recent trends reveal notable regional disparities: Sweden, Austria, and Slovenia experienced the most significant positive shifts, whereas Ireland, the UK, and Iceland saw the largest declines (Figure 2).
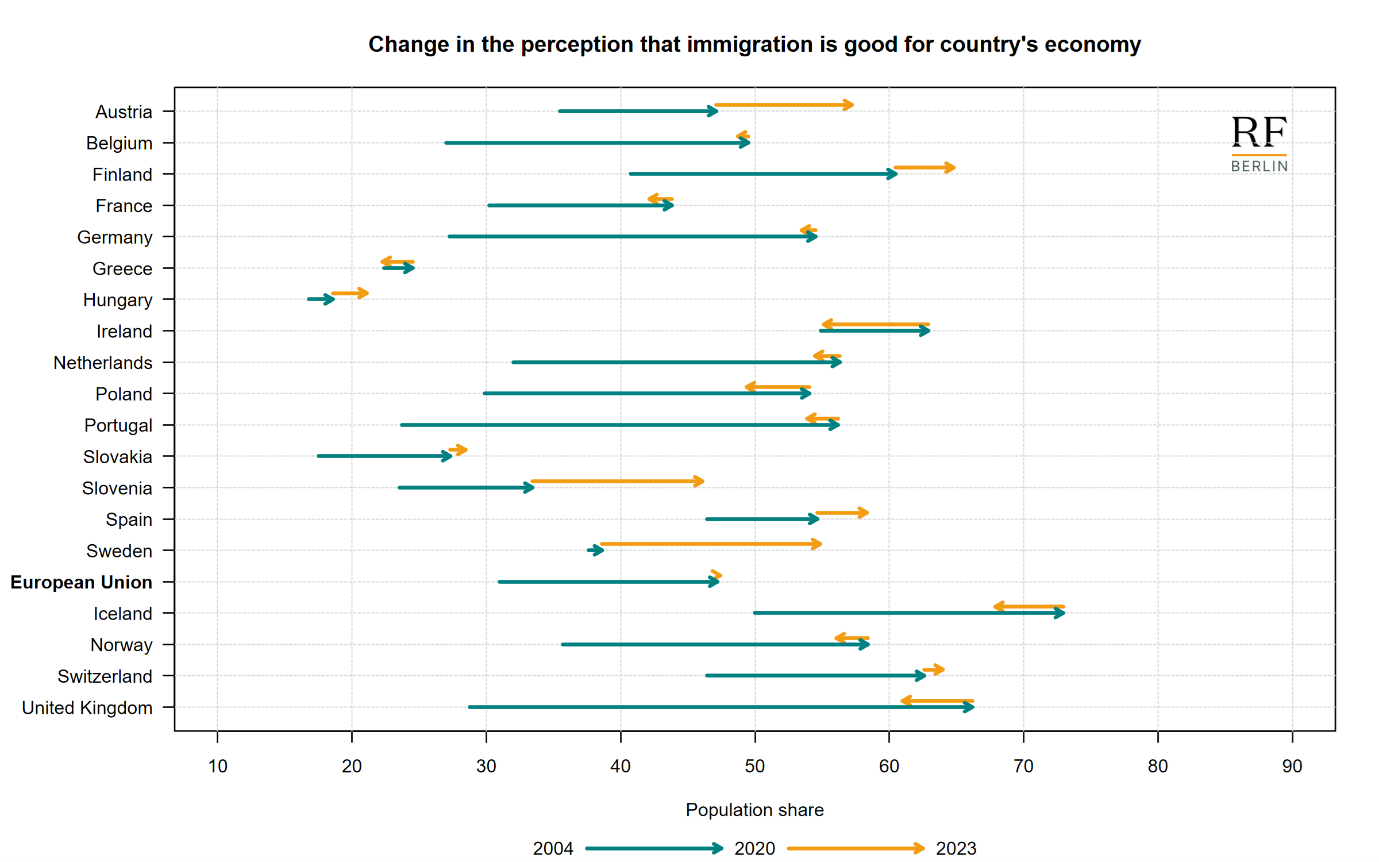
Notes: In the survey, responses to the question” Is it good or bad for country’s economy that people come to live here from other countries?” were rated from 0 to 10, with 0 indicating “bad” and 10 indicating “good”. For this figure, individual responses from 6 to 10 were aggregated and labelled as “good”. A ‘don’t know’ option was also available as an answer. European Union includes all 27 European Member States as of February 1st, 2020. Individual countries reported in the graph are those surveyed in the three years 2004, 2020 and 2023.
We analyse the relationship between education level, gender, and perceptions of immigration’s impact on making the country a better place to live. Figure 3 illustrates the average perceptions across the European Union over time, categorized by gender and education level. The data is grouped into four categories: women with tertiary education, women without tertiary education, men with tertiary education, and men without tertiary education.
Individuals with tertiary education (both men and women) consistently express more positive views about immigration compared to those without tertiary education. Among all groups, women with tertiary education have the most favourable views in the last two survey waves (2020 and 2023). In contrast, attitudes among men and women without tertiary education remain significantly lower, ranging between 20% and 35%.
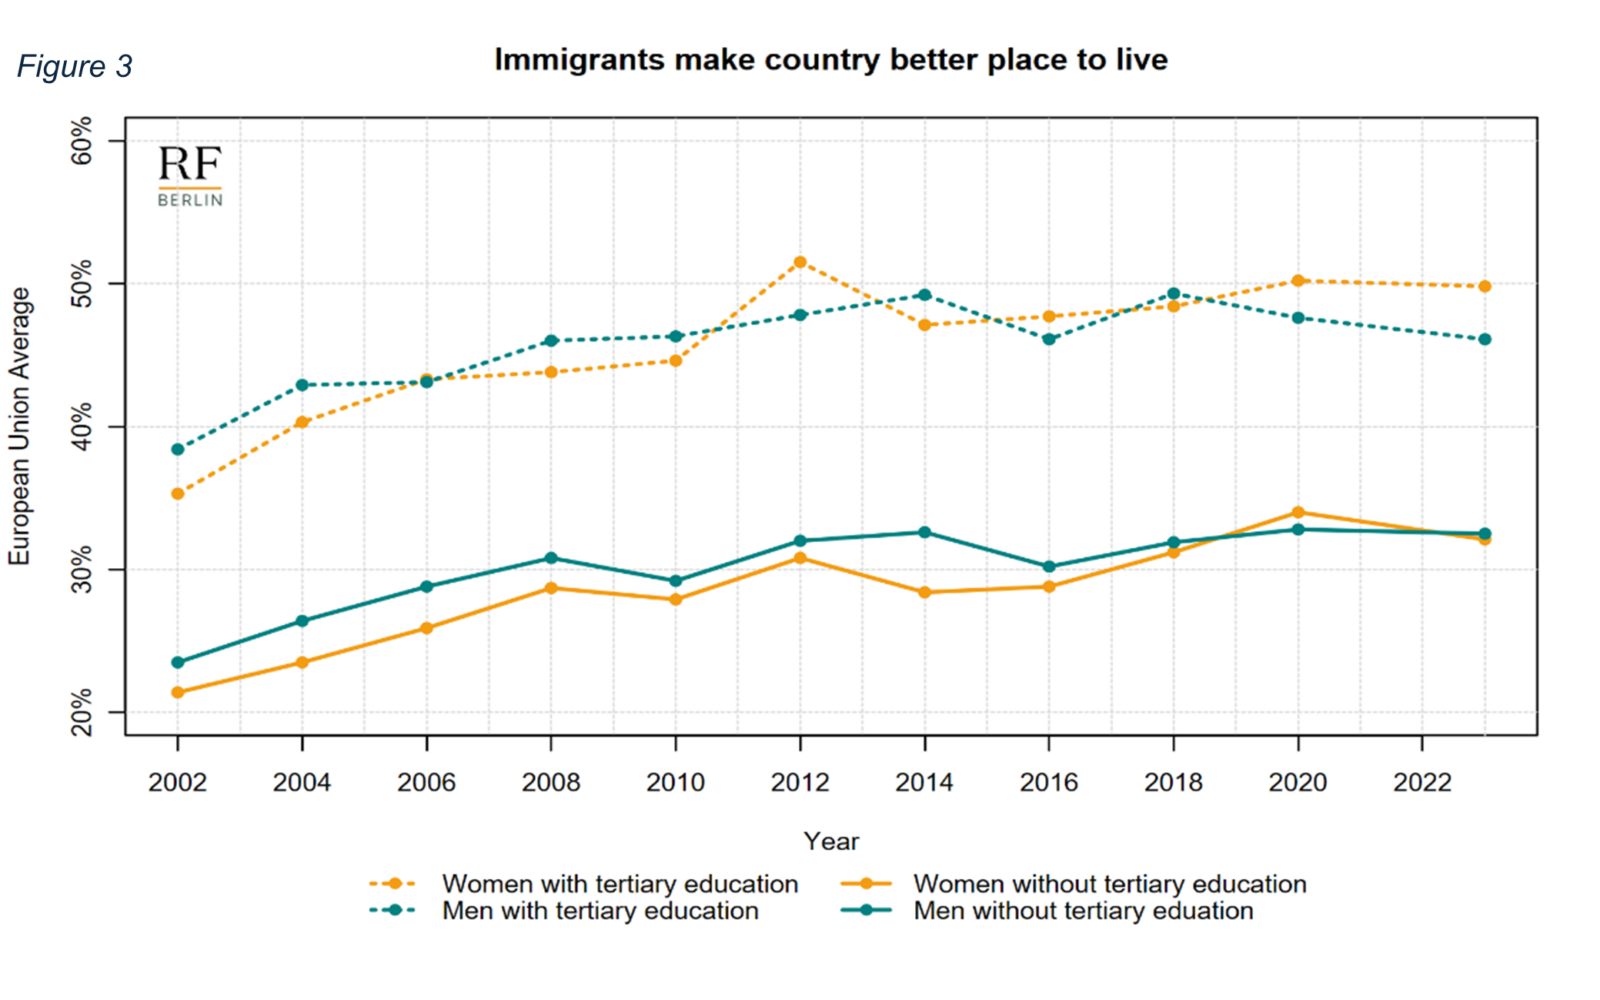
Notes: In the survey, responses to the question “Is country made a worse or a better place to live by people coming to live here from other countries?” were rated from 0 to 10, with 0 indicating “worse” and 10 indicating “better”. For this figure, individual responses from 6 to 10 were aggregated and labelled as” better”. A ‘don’t know’ option was also available as an answer. European Union includes all 27 European Member States as of February 1st, 2020.
Figure 4 examines country-level differences in perceptions of whether immigrants make a country a better place to live, focusing on changes between 2004–2020 and 2020–2023. On average, perceptions across the European Union improved by approximately 10 percentage points between 2004 and 2020. However, this positive trend slightly reversed between the last two survey waves, with the EU average declining from 36.6% in 2020 to 35.7% in 2023.
Consistent with findings on perceptions of immigration’s economic impact, Greece, Hungary, and Slovakia reported the lowest positive perceptions. In contrast, Iceland, Sweden, Norway, Ireland, and the UK ranked among the countries with the most favourable views.
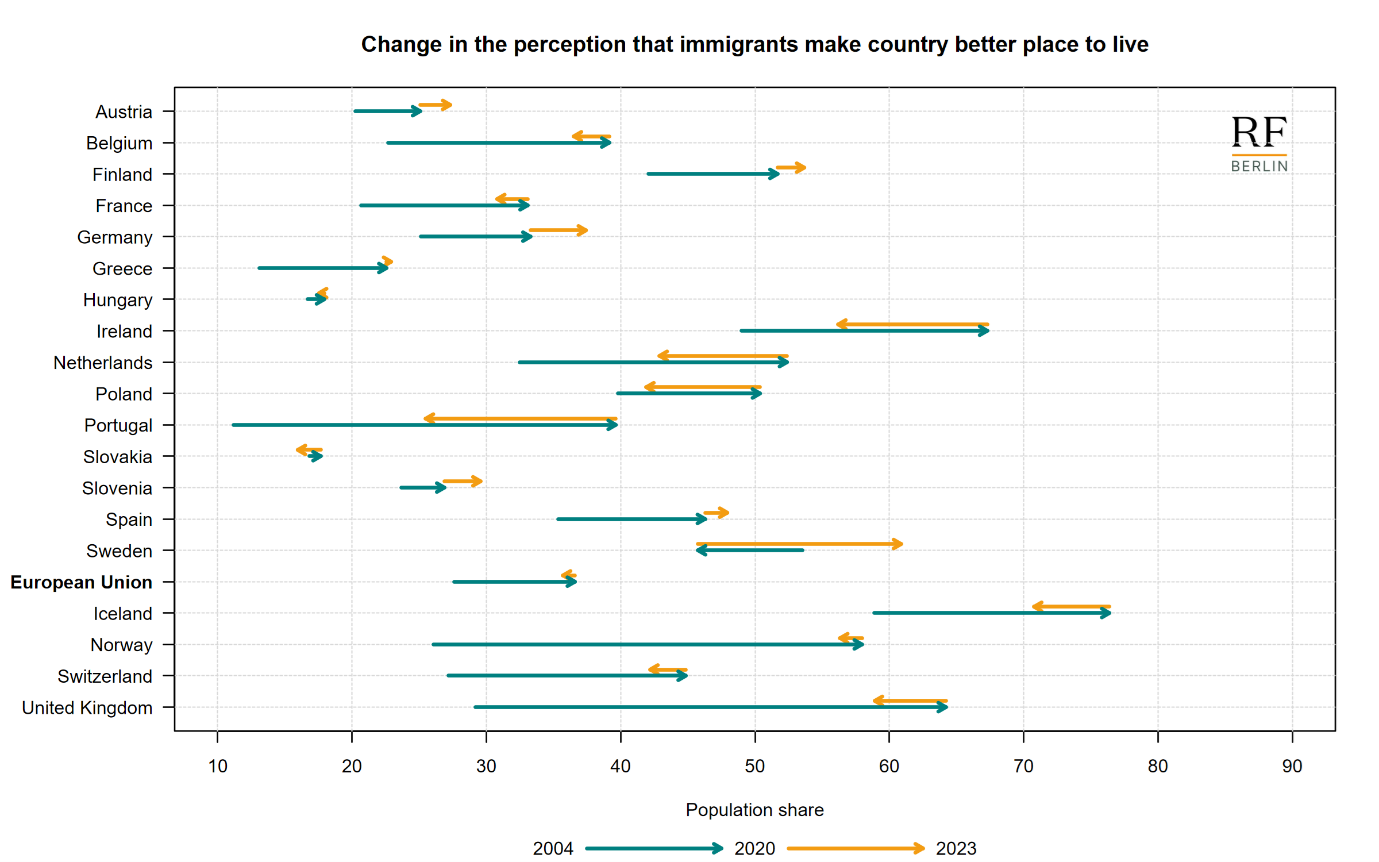
Notes: In the survey, responses to the question “Is country made a worse or a better place to live by people coming to live here from other countries?” were rated from 0 to 10, with 0 indicating “worse” and 10 indicating “better”. For this figure, individual responses from 6 to 10 were aggregated and labelled as” better”. A ‘don’t know’ option was also available as an answer. European Union includes all 27 European Member States as of February 1st, 2020. Individual countries reported in the graph are those surveyed in the three years 2004, 2020 and 2023
Figure 5 presents the European Union’s average perceptions of the belief that “immigrants make the country a better place to live,” broken down by three age groups: 15–24, 25–64, and over 65. While all age groups show a positive trend over time, younger individuals consistently express more favourable views about immigration’s impact on quality of life compared to older individuals. Notably, in the 2023 survey wave, there is a decline in positive perceptions among older individuals.
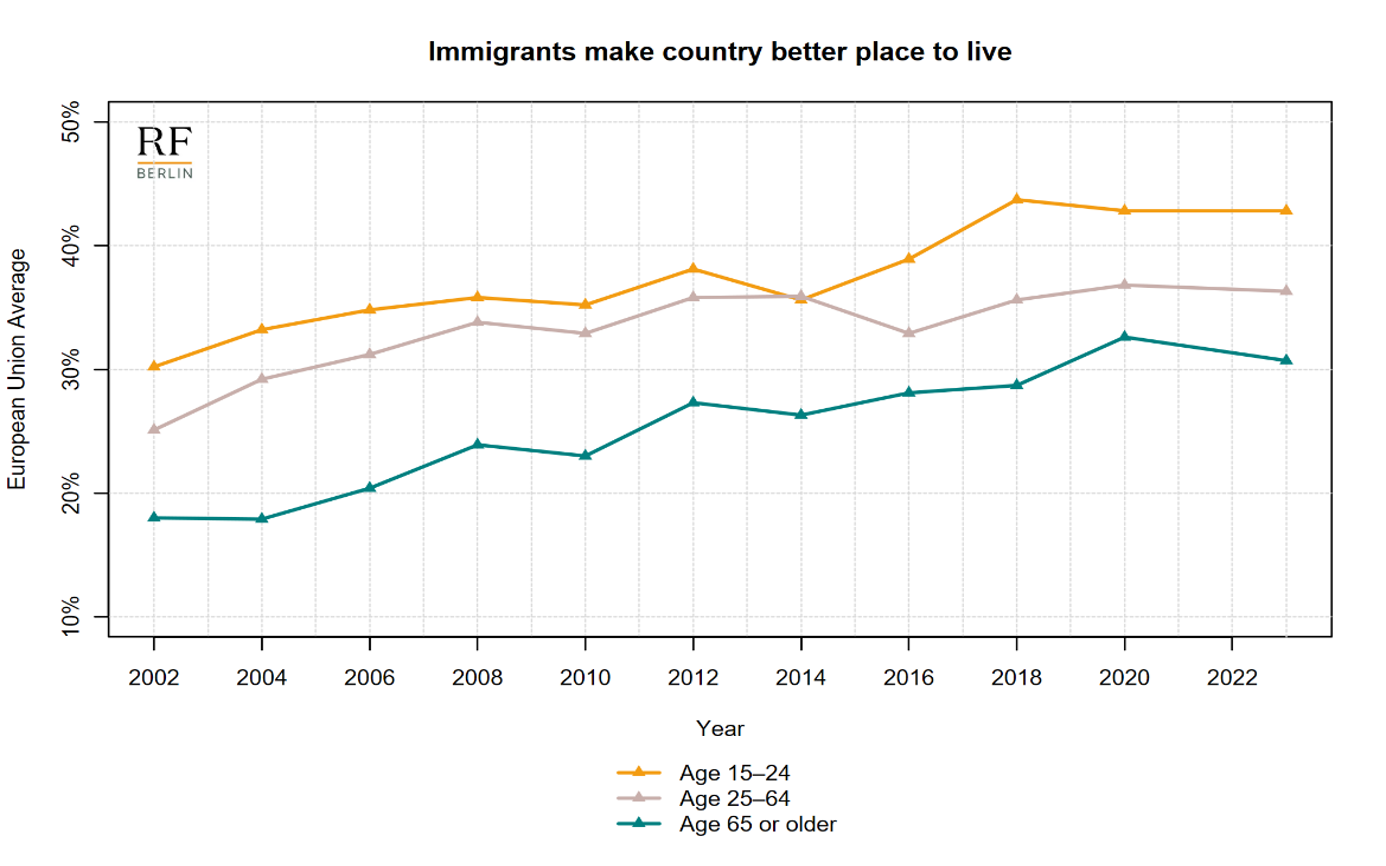
Notes: In the survey, responses to the question “Is country made a worse or a better place to live by people coming to live here from other countries?” were rated from 0 to 10, with 0 indicating “worse” and 10 indicating “better”. For this figure, individual responses from 6 to 10 were aggregated and labelled as” better”. A ‘don’t know’ option was also available as an answer. European Union includes all 27 European Member States as of February 1st, 2020.
Acceptance of immigrants in Europe
We analyse the acceptance of further immigration flows by native-born Europeans over the period from 2002 to 2023. Figure 6 illustrates the evolution of support for increased immigration, categorised by migrants’ origin. We measure this through the share of respondents who believe that “many or some” immigrants from alternative origins (in turn: from a different/the same race or ethnic group as most people in the country, or from poorer countries outside Europe) should be allowed to come and live in the respondent’s country of residence.
Overall, there has been a secular increase in the acceptance of more immigrants in Europe. The highest levels of support are for migrants of the same race or ethnic group as most people living in the host country. In contrast, immigrants of a different ethnicity and those from poorer countries outside Europe receive much lower and comparable levels of acceptance. Between 2002 and 2020, all categories exhibited a positive long-term trend. However, from 2020 to 2023, support declined across all categories by 2 to 3 percentage points, from 76.5% to 74.3% [from 62.9% to 60.8%] for immigrants of the same [different] race or ethnic group as most people in the country, and from 62.5% to 59% for immigrants from poorer countries outside Europe.
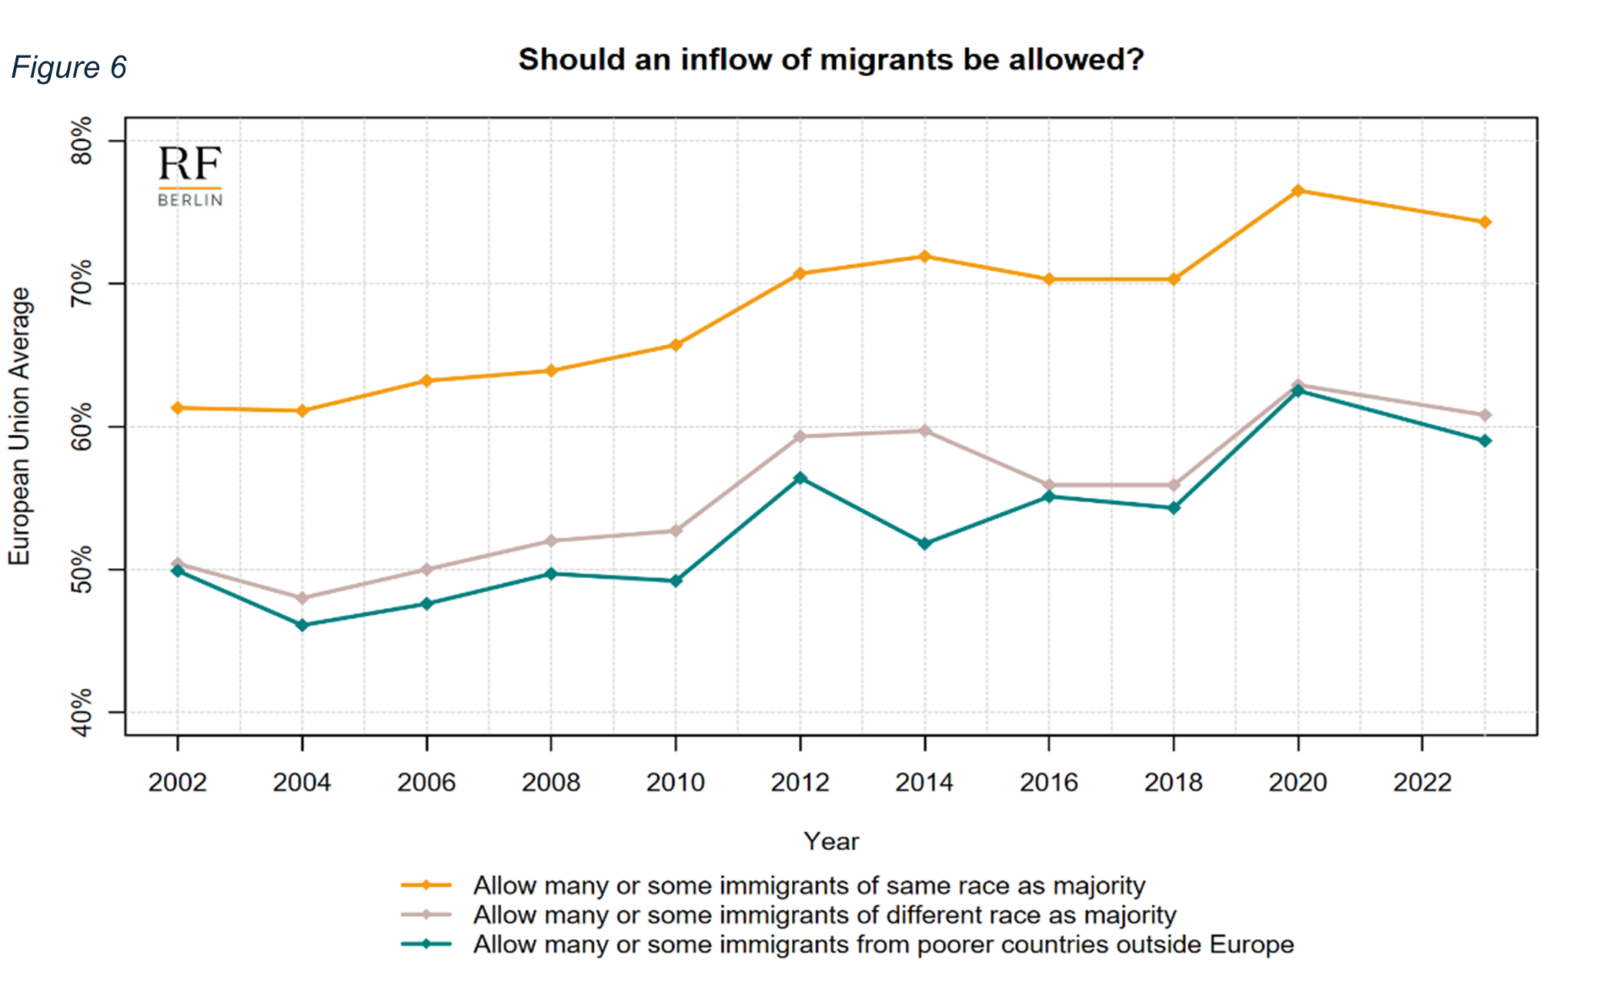
Notes: In the survey, responses to all questions about immigrants’ inflow acceptance included the following options: “allow many”, “allow some”, “allow a few”, and “allow none”. For this figure, individual responses of “allow many” and “allow some” were aggregated. A “don’t know” option was also available as a response. European Union includes all 27 European Member States as of February 1st, 2020.
Likewise, the share of respondents who believe that “few or none” immigrants from the same [different] ethnicity as the majority of the host country population should be allowed to come and live in their country increased from 22.5% to 24% [36.1% to 37.6%] between 2020 and 2023 from 36.6% to 39.4% for immigrants from poor countries outside Europe.
Acceptance of immigrants of a different race or ethnic group than most people in the country majority varies across distinct demographic groups of natives. Figure 7 presents trends for women with tertiary education, women without tertiary education, men with tertiary education, and men without tertiary education. Acceptance levels between men and women remain relatively similar over time. In contrast, education emerges as a significant factor: individuals with tertiary education, irrespective of gender, consistently exhibit higher acceptance rates than those without tertiary education. Notably, the decline in acceptance observed between 2020 and 2023 is primarily driven by natives without tertiary education.
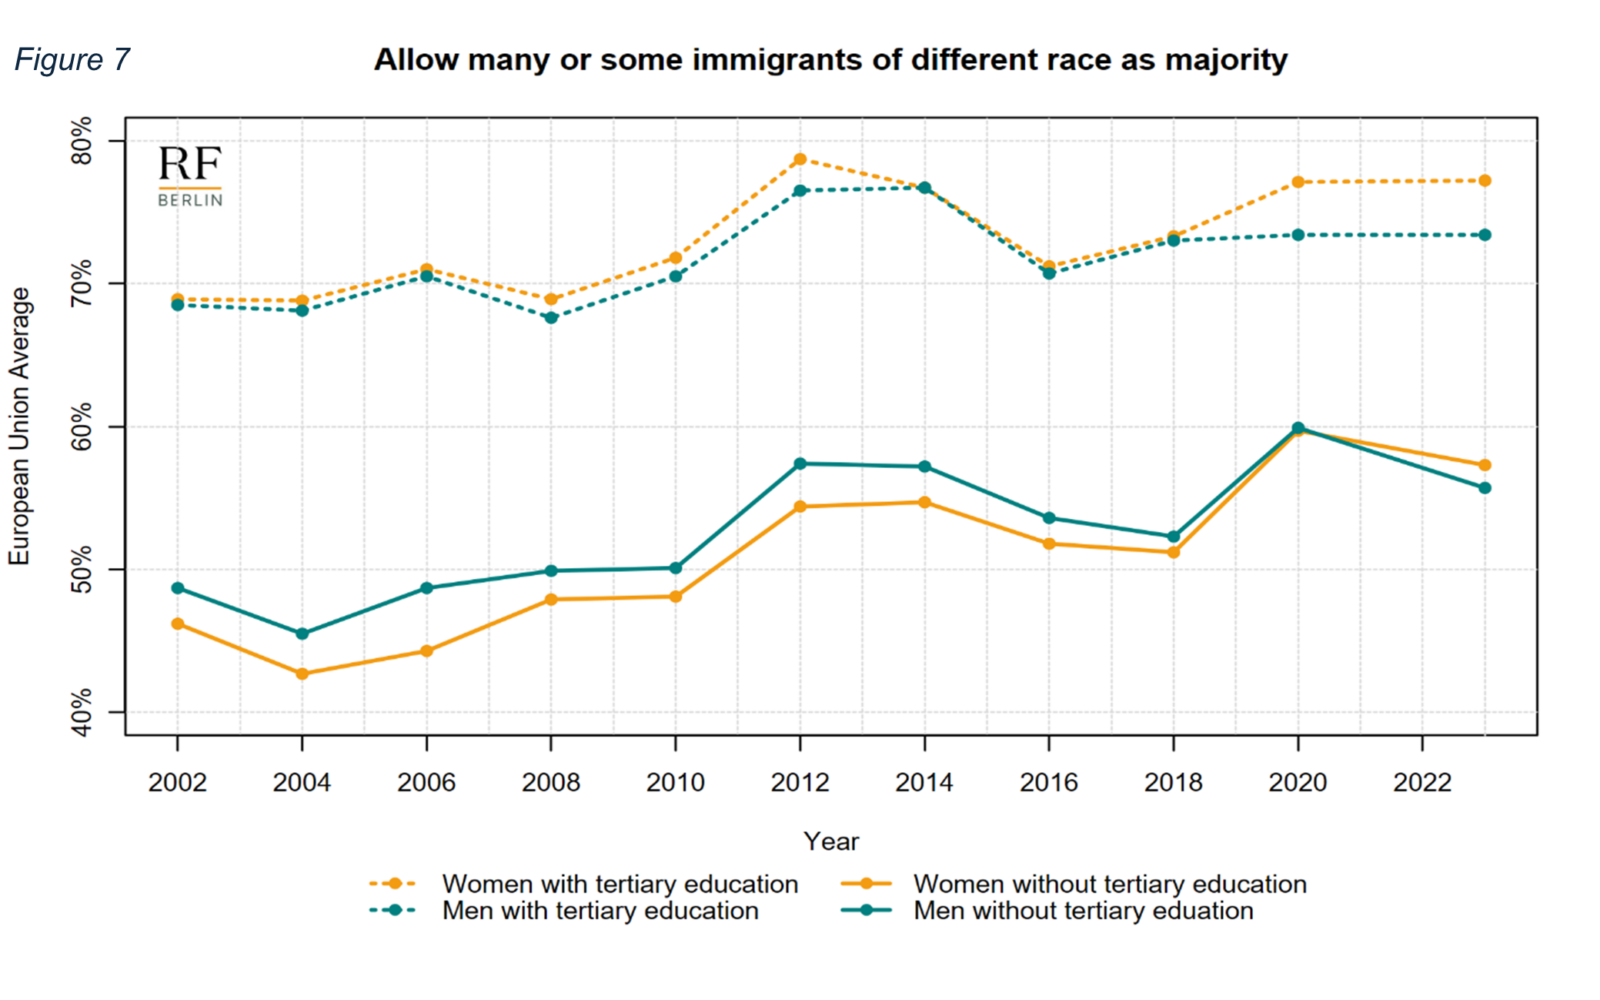
Notes: In the survey, responses to the question “How many immigrants of the different race or ethnic group as most people in the country should be allowed to come and live here?” included the following options: “allow many”, “allow some”, “allow a few”, and “allow none”. For this figure, individual responses of “allow many” and “allow some” were aggregated. A “don’t know” option was also available as a response. European Union includes all 27 European Member States as of February 1st, 2020.
Figure 8 illustrates generational differences in attitudes towards accepting more migrants of different races as the majority in the host country. Individuals under 25 consistently display more favourable views towards accepting migrants compared to older age groups. Since 2020, this trend has widened slightly, with younger individuals showing a further increase in openness towards migrants, while older age groups have exhibited a reversal in the trend. This shift among older individuals has contributed to the overall decline in the acceptance of migrants of different races in the EU.
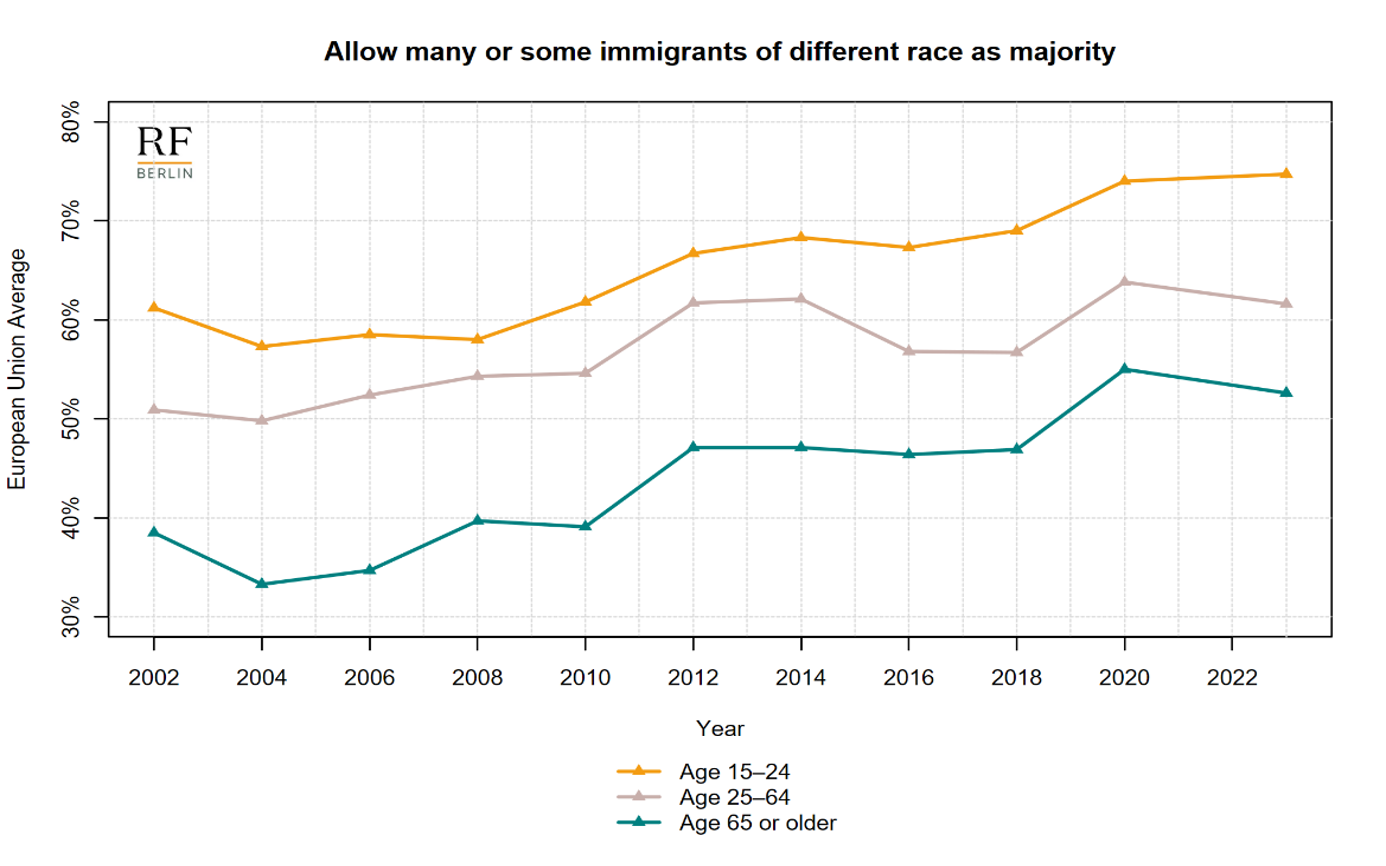
Notes: In the survey, responses to the question “How many immigrants of the different race or ethnic group as most people in the country should be allowed to come and live here?” included the following options: “allow many”, “allow some”, “allow a few”, and “allow none”. For this figure, individual responses of “allow many” and “allow some” were aggregated. A “don’t know” option was also available as a response. European Union includes all 27 European Member States as of February 1st, 2020.
Finally, Figure 9 shows the country heterogeneity in the acceptance of more immigrants of a different race than the native population. From 2004 to 2020, most countries exhibited increasingly positive attitudes towards migration, with the European Union average rising from around 48% in 2004 to approximately 62.9% in 2020. However, the positive trend halted in 2023, when the EU average declined by 2.1 percentage points compared to 2020, stopping at 60.8%.
In 2023, Sweden, Norway, Iceland, and Belgium had the highest acceptance rates for immigrants of a different race among natives, while Greece, Hungary, and Slovakia had the lowest. Several countries experienced a decline in acceptance between 2020 and 2023, with Poland, Portugal and the UK showing the largest drops. Tables 1 and 2 report answers to all three questions for each country in 2020 and 2023.
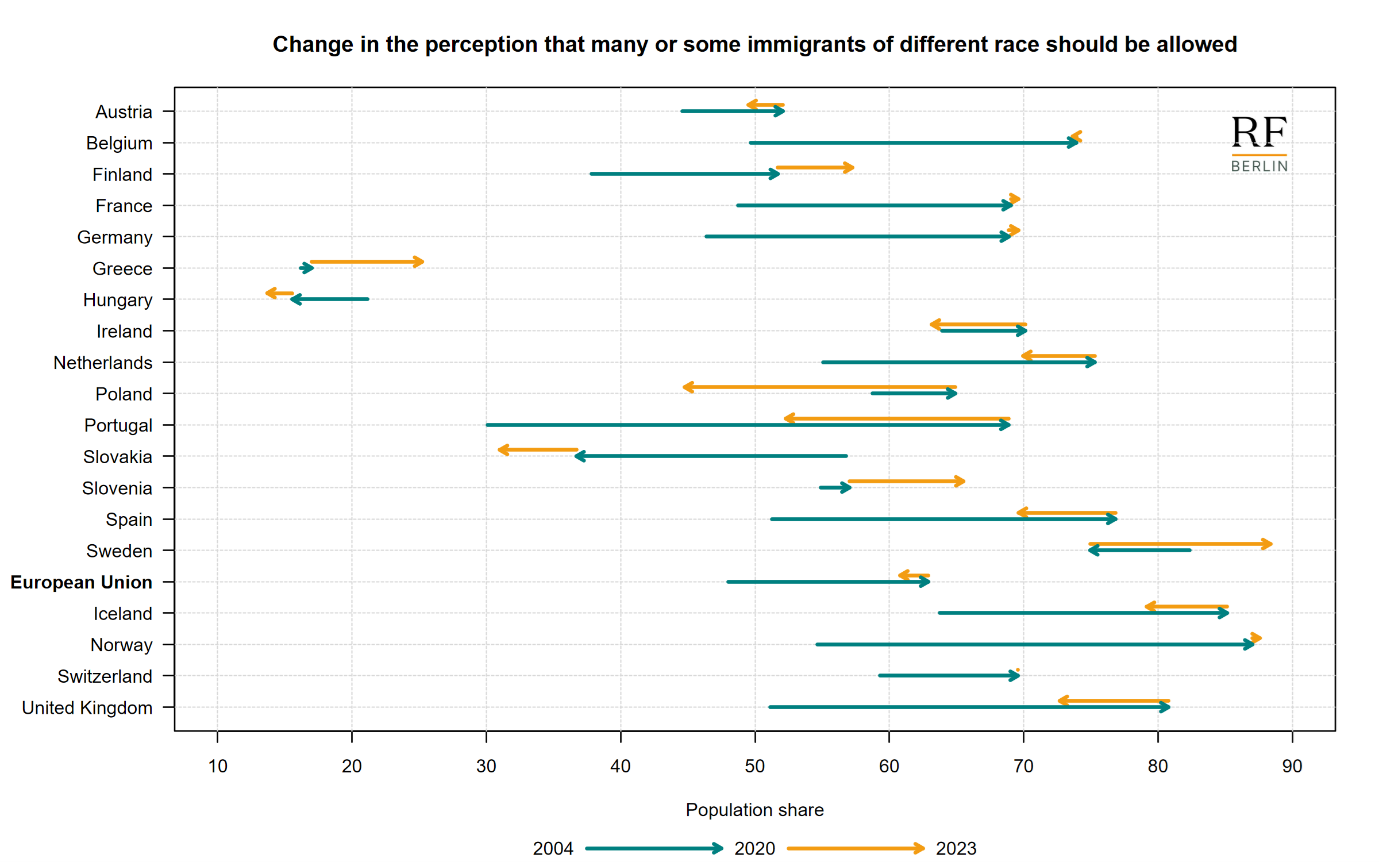
Notes: In the survey, responses to the question “How many immigrants of the different race or ethnic group as most people in the country should be allowed to come and live here?” included the following options: “allow many”, “allow some”, “allow a few”, and “allow none”. For this figure, individual responses of “allow many” and “allow some” were aggregated. A “don’t know” option was also available as a response. European Union includes all 27 European Member States as of February 1st, 2020. Individual countries reported in the graph are those surveyed in the three years 2004, 2020 and 2023.
Table 1
| Many or some immigrants from …. should be allowed to come and live in the country | ||||||
| Same ethnic group as most people in the country (%) | Different ethnic group as most people in the country (%) | Poorer countries outside Europe (%) | ||||
| 2020 | 2023 | 2020 | 2023 | 2020 | 2023 | |
| EU Countries | ||||||
| European Union | 76.5 | 74.3 | 75.3 | 70.0 | 62.5 | 59.0 |
| Austria | 79.4 | 77.2 | 52.1 | 49.5 | 53.8 | 41.5 |
| Belgium | 84.1 | 83.5 | 73.9 | 73.7 | 71.8 | 70.3 |
| Bulgaria | 71.0 | 45.6 | 40.7 | |||
| Croatia | 68.6 | 68.7 | 59.7 | 58.0 | 58.0 | 58.3 |
| Cyprus | 56.3 | 49.9 | 32.3 | 24.5 | 32.7 | 18.7 |
| Czechia | 43.3 | 26.8 | 26.0 | |||
| Denmark | ||||||
| Estonia | 79.4 | 58.8 | 46.7 | |||
| Finland | 75.9 | 80.7 | 51.7 | 57.3 | 47.4 | 50.5 |
| France | 78.9 | 80.1 | 69.0 | 69.6 | 68.2 | 66.3 |
| Germany | 86.5 | 86.3 | 68.9 | 69.6 | 69.2 | 64.8 |
| Greece | 61.1 | 68.7 | 17.0 | 25.2 | 15.4 | 17.4 |
| Hungary | 39.0 | 29.8 | 15.6 | 13.7 | 13.2 | 13.8 |
| Ireland | 76.0 | 70.8 | 70.1 | 63.2 | 66.0 | 60.2 |
| Italy | 67.8 | 65.8 | 58.7 | 53.8 | 60.0 | 57.5 |
| Latvia | 82.7 | 55.4 | 49.3 | |||
| Lithuania | 76.0 | 80.1 | 59.5 | 58.7 | 51.3 | 52.8 |
| Luxembourg | ||||||
| Malta | ||||||
| Netherlands | 78.5 | 73.3 | 75.3 | 70.0 | 67.8 | 60.0 |
| Poland | 82.8 | 65.5 | 64.9 | 44.8 | 69.7 | 49.0 |
| Portugal | 74.8 | 57.2 | 68.9 | 52.3 | 69.9 | 53.7 |
| Romania | ||||||
| Slovakia | 52.0 | 47.5 | 36.7 | 31.0 | 36.2 | 33.2 |
| Slovenia | 80.5 | 83.3 | 57.0 | 65.5 | 56.5 | 65.2 |
| Spain | 81.7 | 74.9 | 76.8 | 69.6 | 75.8 | 68.7 |
| Sweden | 82.8 | 92.2 | 74.9 | 88.4 | 68.6 | 86.1 |
| Non-EU | ||||||
| Iceland | 95.9 | 94.0 | 85.1 | 79.2 | 87.8 | 95.9 |
| Norway | 90.5 | 90.4 | 87.0 | 87.6 | 83.9 | 90.5 |
| Switzerland | 85.1 | 87.0 | 69.6 | 69.6 | 66.0 | 85.1 |
| United Kingdom | 84.7 | 75.6 | 80.8 | 72.7 | 76.9 | 84.7 |
Table 2
| Few or no immigrants from …. should be allowed to come and live in the country | ||||||
| Same ethnic group as most people in the country (%) | Different ethnic group as most people in the country (%) | Poorer countries outside Europe (%) | ||||
| 2020 | 2023 | 2020 | 2023 | 2020 | 2023 | |
| EU Countries | ||||||
| European Union | 22.5 | 24.0 | 36.1 | 37.6 | 36.6 | 39.4 |
| Austria | 20.6 | 21.4 | 47.9 | 48.9 | 46.2 | 20.6 |
| Belgium | 15.2 | 15.8 | 25.5 | 25.7 | 27.7 | 15.2 |
| Bulgaria | 25.9 | 51.2 | 56.4 | 25.9 | ||
| Croatia | 29.4 | 29.9 | 38.4 | 40.2 | 39.7 | 29.4 |
| Cyprus | 43.7 | 48.7 | 67.7 | 74.3 | 67.3 | 43.7 |
| Czechia | 55.7 | 72.6 | 73.3 | 55.7 | ||
| Denmark | ||||||
| Estonia | 20.3 | 41.0 | 53.0 | 20.3 | ||
| Finland | 21.8 | 18.5 | 46.6 | 41.8 | 50.7 | 21.8 |
| France | 18.2 | 17.1 | 28.5 | 28.2 | 29.7 | 18.2 |
| Germany | 13.5 | 12.0 | 31.1 | 29.0 | 30.8 | 13.5 |
| Greece | 37.4 | 30.7 | 81.5 | 73.9 | 82.9 | 37.4 |
| Hungary | 58.4 | 68.6 | 81.5 | 84.6 | 83.4 | 58.4 |
| Ireland | 22.7 | 28.1 | 28.2 | 35.8 | 30.7 | 22.7 |
| Italy | 30.8 | 32.5 | 39.9 | 44.5 | 38.7 | 30.8 |
| Latvia | 17.3 | 44.6 | 50.7 | 17.3 | ||
| Lithuania | 21.8 | 18.4 | 39.3 | 39.8 | 46.7 | 21.8 |
| Luxembourg | ||||||
| Malta | ||||||
| Netherlands | 20.3 | 25.3 | 23.7 | 29.1 | 31.1 | 20.3 |
| Poland | 17.2 | 33.1 | 35.1 | 53.5 | 30.3 | 17.2 |
| Portugal | 23.1 | 42.0 | 28.6 | 46.7 | 27.9 | 23.1 |
| Romania | ||||||
| Slovakia | 48.1 | 51.1 | 63.3 | 67.7 | 63.9 | 48.1 |
| Slovenia | 18.7 | 15.5 | 42.0 | 33.1 | 42.6 | 18.7 |
| Spain | 18.3 | 23.8 | 23.2 | 28.8 | 24.2 | 18.3 |
| Sweden | 17.3 | 6.6 | 25.1 | 10.5 | 31.4 | 17.3 |
| Non-EU | ||||||
| Iceland | 4.1 | 5.0 | 14.9 | 19.1 | 12.2 | 4.1 |
| Norway | 9.5 | 9.1 | 13.0 | 11.9 | 16.1 | 9.5 |
| Switzerland | 13.7 | 12.0 | 29.2 | 29.0 | 32.7 | 13.7 |
| United Kingdom | 13.7 | 21.3 | 17.8 | 25.0 | 22.3 | 13.7 |


