Summary
- The share of foreign-born individuals in EU countries has increased from 13.6% in 2023 to 14.1% in 2024.
- After peaking at 6.2 million in 2022, migrant inflows dropped to 4 million in 2023, with 77% coming from non-EU countries.
- Germany’s immigrant population rose from 16.9 million in 2023 to 17.4 million in 2024 (or from 20.3% to 20.9% of the population), confirming its role as the major destination in EU.
- In 2024, around three out of four immigrants in the EU are in working age (15-64 years old).
- Asylum applications in the EU surpassed 1 million in 2023 and decreased to 0.9 million in 2024
- The refugee population in the EU reached 7.4 million in 2023, representing 1.7% of the total population and 12.2% of the foreign-born population.
The EU’s foreign-born population has grown steadily from around 41 million in 2010 to over 63 million in 2024, representing an increase from 10% to 14.1% of the total EU population. This rise highlights the EU’s growing role as a destination for individuals migrating from non-EU countries, as well as for those relocating within the EU.
Figure 1 shows a sharp increase in the resident immigrant population in the EU from 2022 to 2024, with a net growth of nearly 7 million people. This recent surge was driven primarily by inflows from non-EU countries, rather than intra-EU migration, as we show in Figure A.1 in appendix and later in Figure 4.1 As of 2024, out of the 63.3 million migrants in the EU, 28.6% were from another EU country and 71.4% from outside the EU.
Figure 1
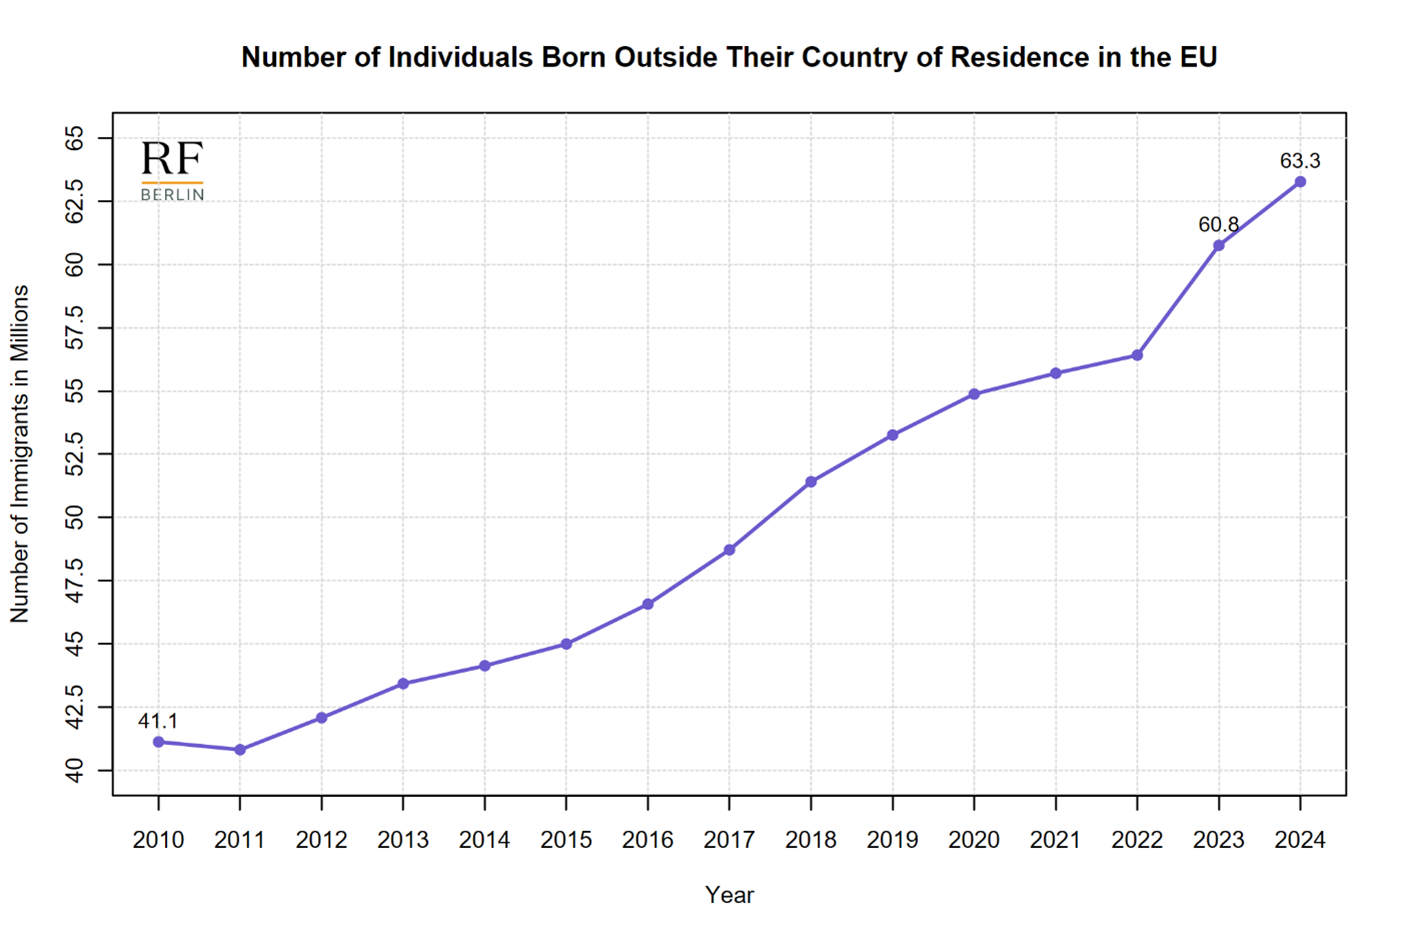
Source: Eurostat, MIGR_POP3CTB. Notes: The figure reports the number of immigrants who reside in the European Union in each year. Immigrants are defined as individuals born in a country other than the one in which they reside. The total also includes individuals with an unknown country of birth. The European Union includes all 27 member states as of February 1, 2020.
Figure 2 depicts the trend in the number of immigrants in the four largest EU countries by immigrant population and the rest of the EU countries. From 2010 to 2024, Germany, France, Italy and Spain all experienced steady increases in their immigrant populations, with Germany’s growth being particularly pronounced starting in 2016. Germany’s immigrant population rose from around 11 million in 2015 to 17.4 million in 2024 (or from 13.4% to 20.9% of the population). Spain saw an increase of almost 3 million immigrants, from 5.9 million to 8.8 million over the same period (from 12.7% to 18.2% of the resident population), while France and Italy experienced more modest growth. All other EU countries combined saw an increase of about 6 million immigrants between 2015 and 2024, an amount comparable to that of Germany alone.
Figure 2
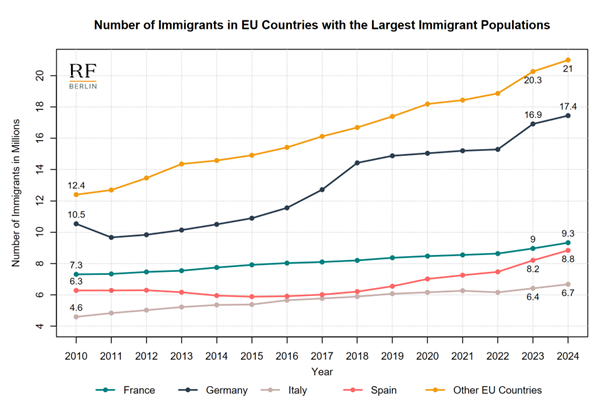
Source: Eurostat, MIGR_POP3CTB. Notes: The figure reports the number of immigrants who reside in the named country in each year. Immigrants are defined as individuals born in a country other than the one in which they reside. The European Union includes all 27 member states as of February 1, 2020.
Between 2010 and 2024, the share of foreign-born individuals in the EU’s resident population increased from 10% to 14.1%, with the most significant growth occurring in the second half of this period (Figure 3). Malta, Luxembourg, Portugal, and Germany recorded the largest increases in foreign-born population shares. Notably, Germany’s foreign-born population rose by 8 percentage points during this timeframe, from 12.9% to 20.9%. This upward trend in migrant populations was nearly universal across EU countries over the 14-year period, with Greece and Latvia standing as notable exceptions.
Figure 3
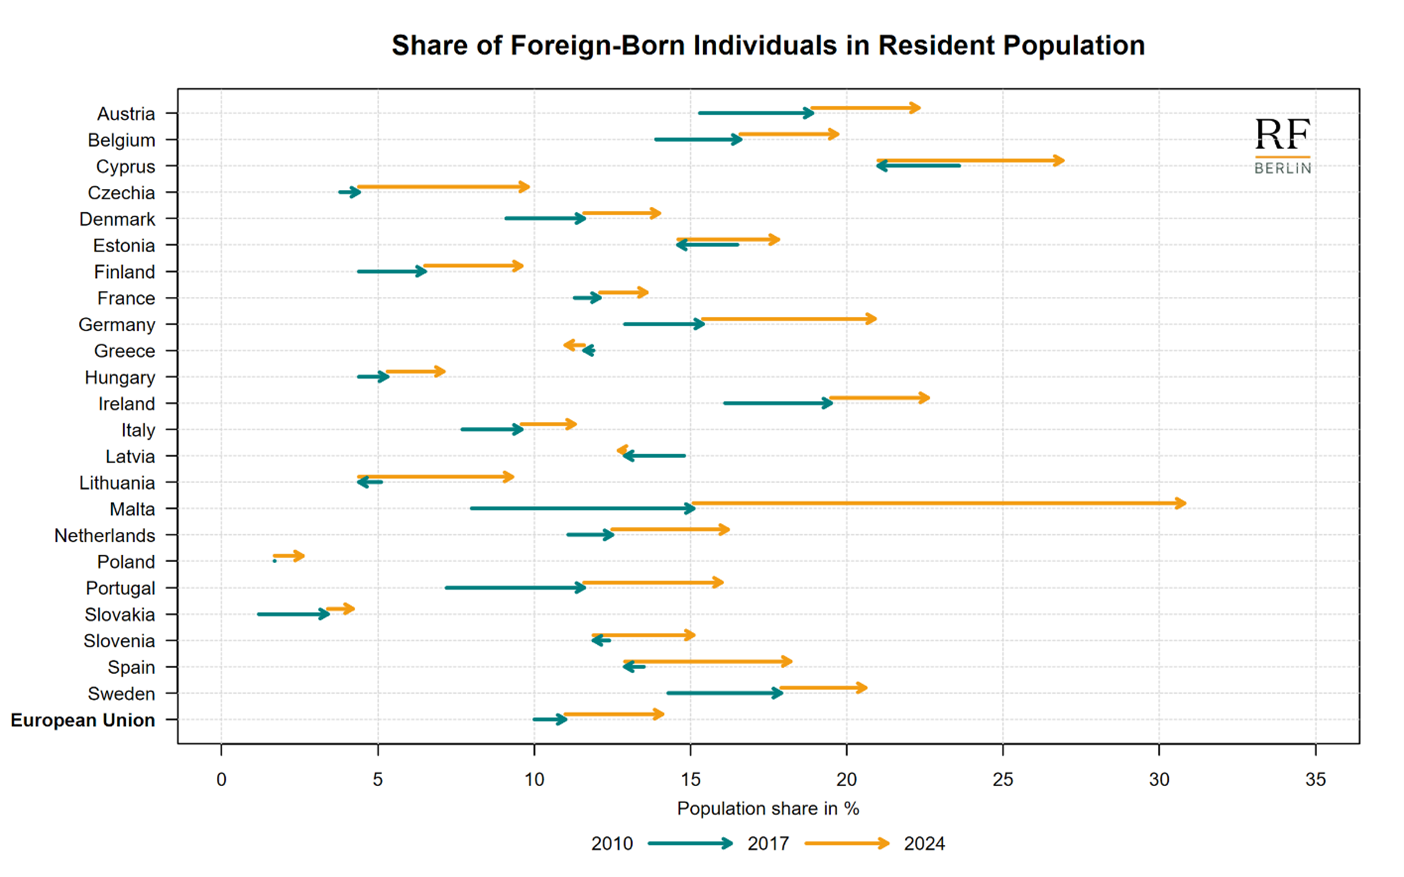
Source: Eurostat, MIGR_POP3CTB. Notes: The figure reports the changes in the share of immigrants over the resident population between 2010 and 2017, and between 2017 and 2024, for each country on the vertical axis. Immigrants are defined as individuals born in a country other than the one in which they reside. The European Union includes all 27 member states as of February 1, 2020. Shares for Bulgaria, Croatia and Romania are not represented due to missing data. Luxembourg is not included due to its comparatively high share, which would distort the representation. Luxembourg’s shares are: 33% in 2010, 45.8% in 2017, and 51.1% in 2024.
The share of working-age migrants (individuals aged 15 to 64) over the total working age European population has increased from 12.2% in 2010 to 16.9% in 2024. This trend is evident even though the share of working-age migrants within the total foreign-born population has declined from 81% in 2010 to 76.5% in 2024 (Appendix Table A.1). Distinct trends are evident among the four largest EU countries. While for Spain and Italy the share of foreign-born people in working age has remained stable at around 85% over the last 14 years, for Germany and France such share has decreased over the same period (Appendix Table A.2). The gender composition of foreign-born populations in the EU has remained relatively stable over time (Appendix Table A.3). However, notable variations emerge among the four largest EU countries. Italy, in particular, displays a significantly higher proportion of female migrants compared to Germany, France, and Spain (Appendix Table A.4).
Figure 4
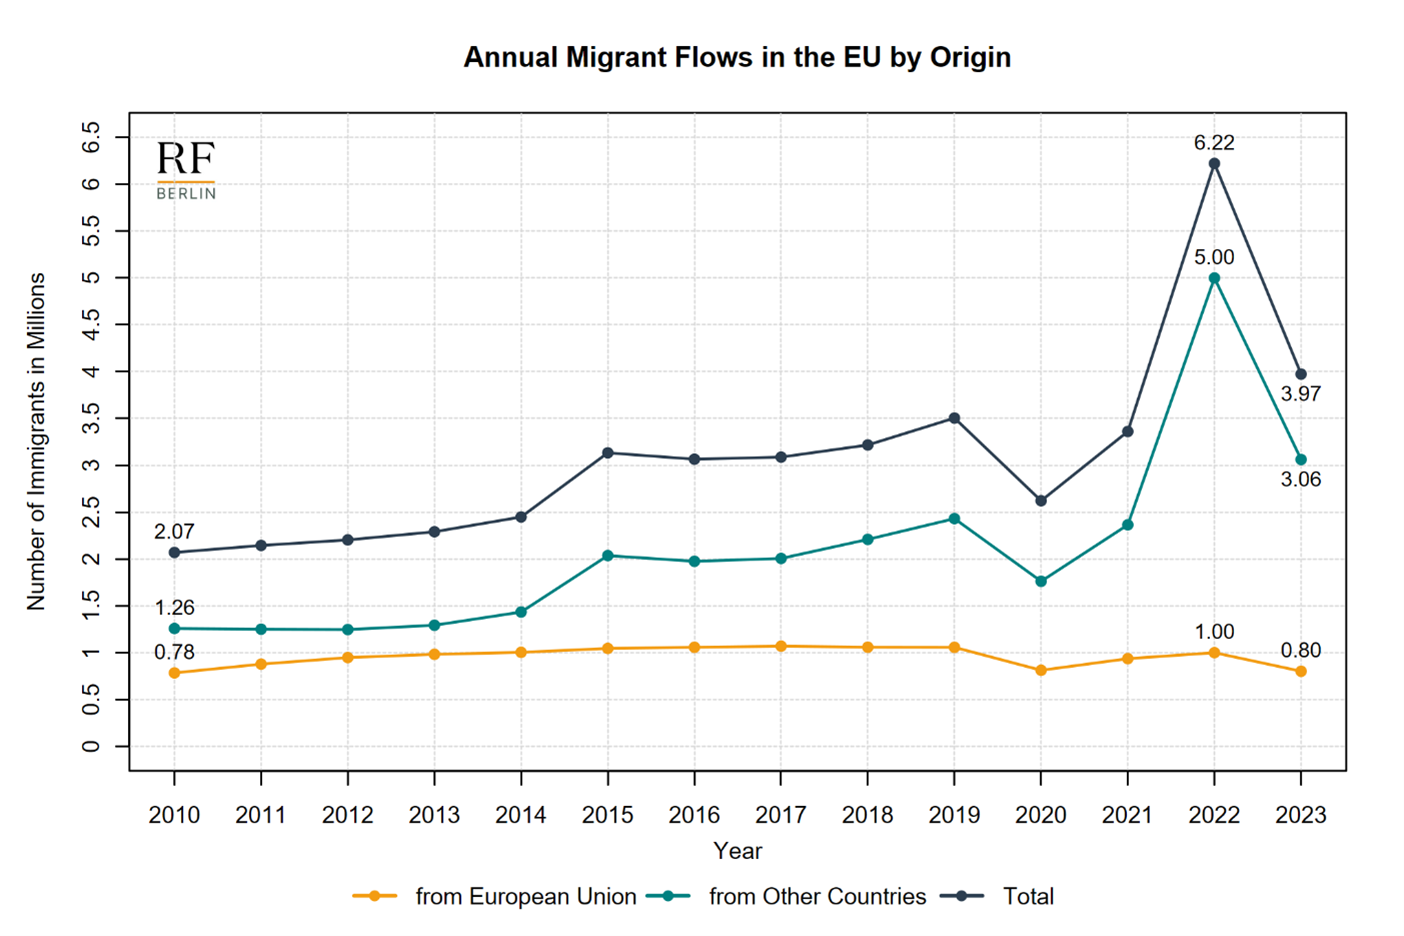
Source: Eurostat, MIGR_IMM3CTB. Notes: The figure reports the number of migrants who arrived in the EU during the year. Migrants are defined as individuals born in a country other than the one in which they reside. The total also includes individuals with an unknown country of birth. The European Union includes all 27 member states as of February 1, 2020.
Figure 4 depicts the trend in inflows of migrants into the EU, distinguishing by origin area. The overall trend is primarily shaped by inflows of migrants from outside the EU, while intra-EU migration has remained stable at around one million individuals per year. The annual inflow of non-EU migrants fluctuated between 2 and 2.5 million from 2015 to 2019, dropped below 2 million in 2020, likely due to COVID-19 restrictions, and rebounded to pre-pandemic levels in 2021. In 2022, the EU experienced a doubling of non-EU migrant inflows, from 2.5 million to 5 million.
Figure 5
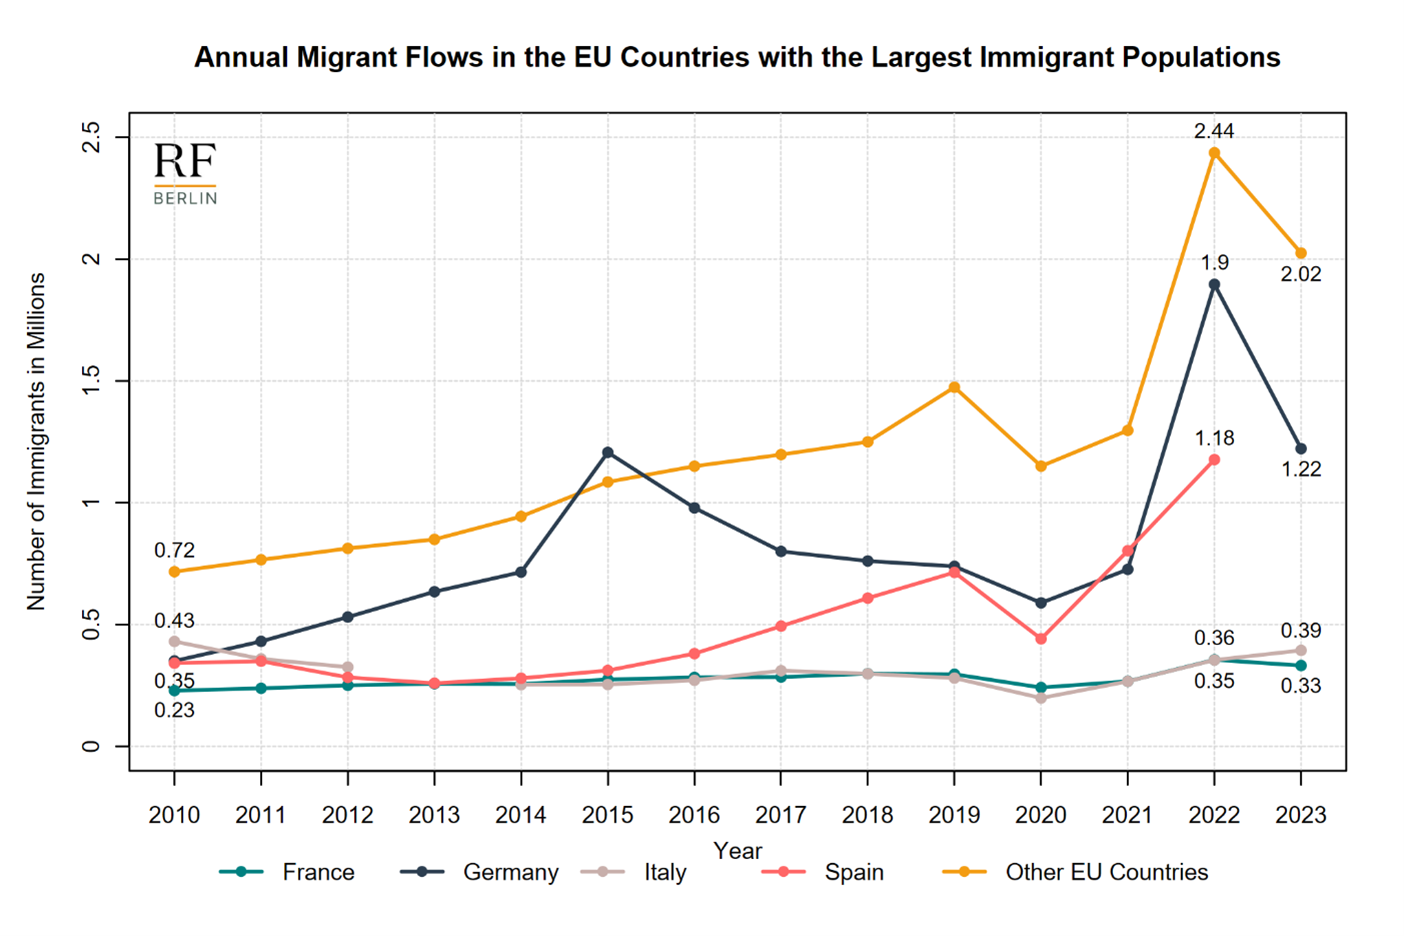
Source: Eurostat, MIGR_IMM3CTB. Notes: The figure reports the number of migrants who arrived in the named country during the year. Migrants are defined as individuals born in a country other than the one in which they reside. The European Union includes all 27 member states as of February 1, 2020. Data for Spain in 2023 are not available at the time of compiling this report.
Figure 5 illustrates the trend of migrant inflows between 2010 and 2023 in the four largest EU countries by immigrant population and the rest of the EU. While all countries show a decline in 2020 due to the pandemic, their trends differ over the period. Inflows in France and Italy remain relatively stable at around 0.2-0.4 million per year. Germany shows a first peak in 2015 due to the so called “refugee crisis”, and a sharp rise of 1.2 million in 2022 compared to the previous year. Finally, Spain experiences a stable increase in migrant inflows starting in 2015 and peaking in 2022 at 1.2 million arrivals.
Figures 6 and 7 focus on a subset of the foreign-born population in the EU: refugees.2 Figure 6 shows that from 2010 to 2024, the number of first-instance asylum applicants in the EU increased in several waves. The Syrian crisis led in 2015 to a first peak of over 1.2 million applicants. After declining to around 600,000 applicants by 2018, asylum applications rose again in 2022 and surpassed 1 million in 2023. Table A.5 in the Appendix shows that recent increases in applications have primarily involved nationals of Middle Eastern and South American countries (including Syria, Afghanistan, Turkey, Iraq, Venezuela, and Colombia).
Figure 6
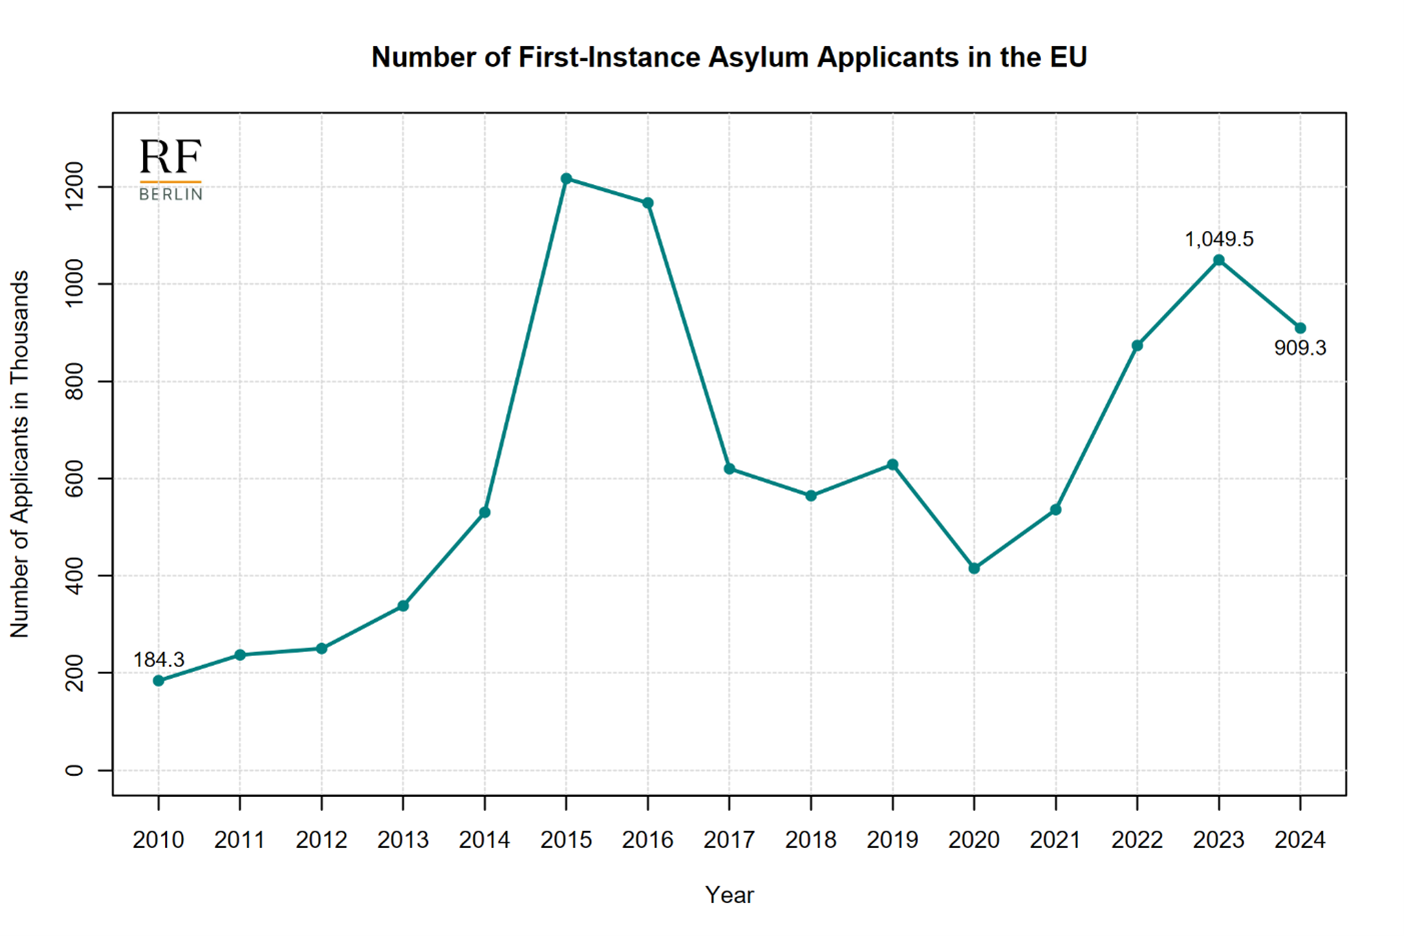
Source: Eurostat, MIGR_ASYAPPCTZA. Notes: The figure reports the number of first-instance asylum applications submitted in EU countries during the year. The European Union includes all 27 member states as of February 1, 2020.
Figure 7 shows the change in the refugee population between 2010 and 2023 across the 27 EU countries. Germany, Poland, Spain, Czechia, and France experienced the largest growth in the number of refugees, with Germany seeing its refugee population double over the period, reaching 2.6 million by 2023 (3.1% of the total population and 14.9% of the foreign-born population).3 Overall, the EU’s refugee population increased from 2.1 million in 2010 to 7.4 million in 2023 (i.e., from 0.5% to 1.7% of the total population and from 5.1% to 12.2% of the foreign-born population) .4
Figure 7
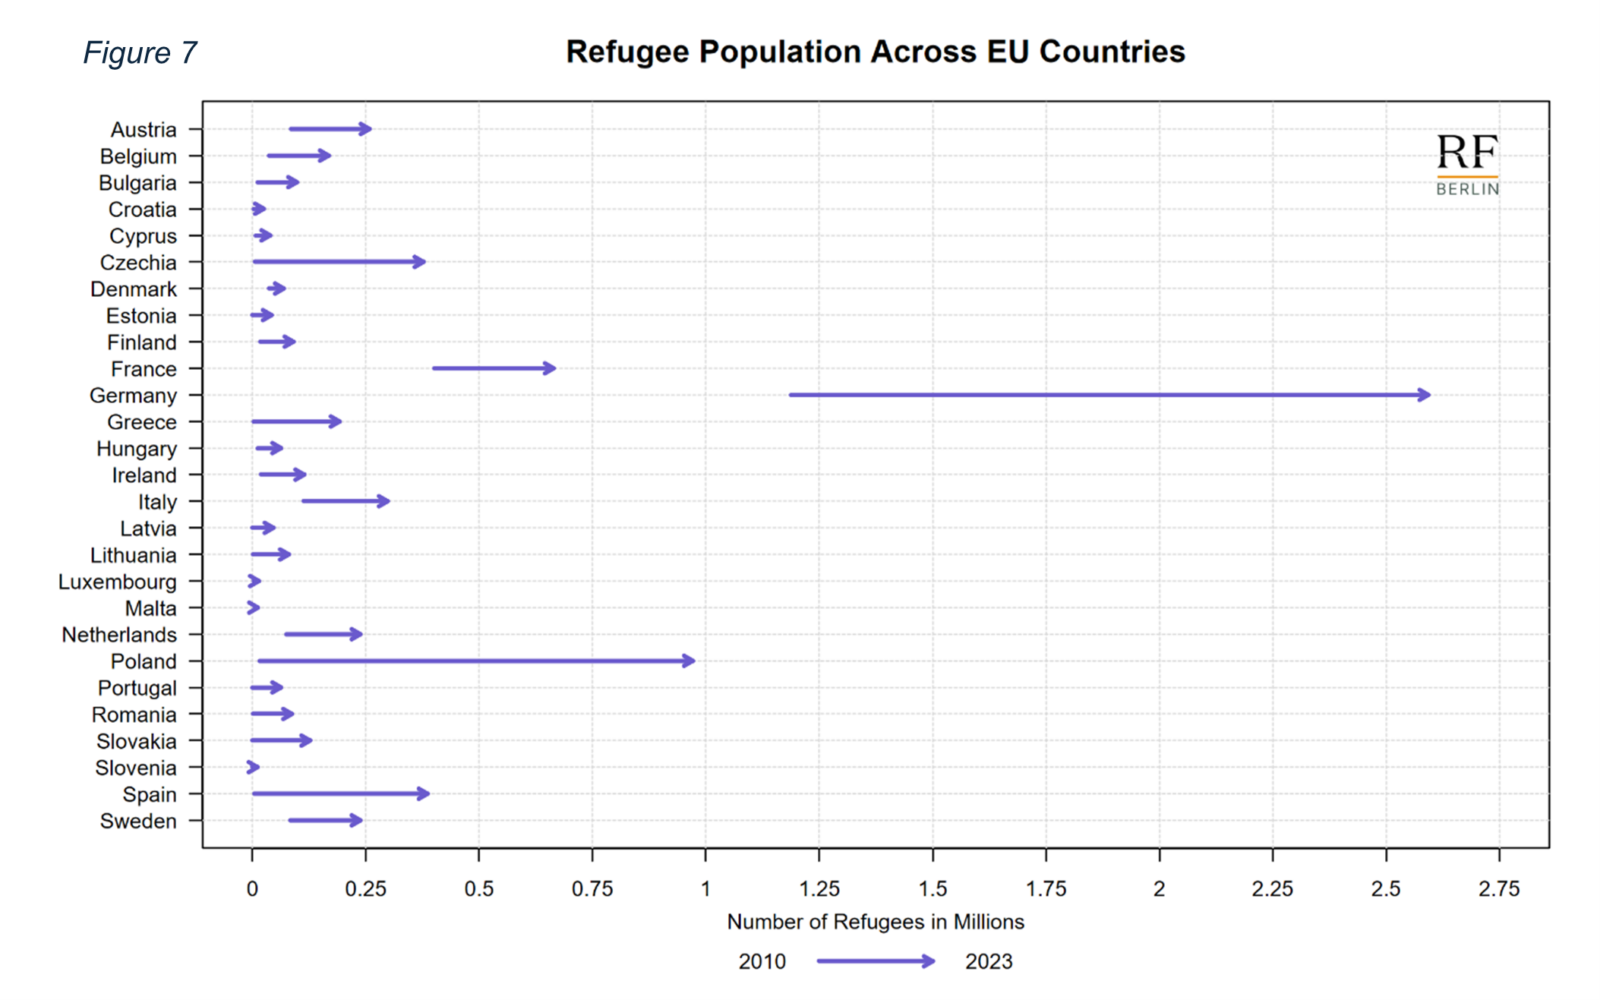
Source: UNHCR. Notes: Refugees include individuals recognized under the 1951 Convention relating to the Status of Refugees, its 1967 Protocol, the 1969 Organization of African Unity (OAU) Convention Governing the Specific Aspects of Refugee Problems in Africa, the refugee definition contained in the 1984 Cartagena Declaration on Refugees as incorporated into national laws, those recognized in accordance with the UNHCR Statute, individuals granted complementary forms of protection, and those enjoying temporary protection. The refugee population also includes people in refugee-like situations. The figure reports data for the 27 member states in the European Union as of February 1, 2020.
Footnotes
- The arrival of Ukrainian refugees under temporary protection could have contributed to such an increase. Data on inflows of Ukrainian citizens in Europe under temporary protection for 2022–2024 are sourced from Eurostat (migr_asytpfa), with recorded figures of 4,270,030 (2022), 1,043,235 (2023), and 772,605 (2024). ↩︎
- According to UNHCR, refugees and asylum seekers are defined as follows: “Refugees include individuals recognized under the 1951 Convention relating to the Status of Refugees, its 1967 Protocol, the 1969 Organization of African Unity (OAU) Convention Governing the Specific Aspects of Refugee Problems in Africa, the refugee definition contained in the 1984 Cartagena Declaration on Refugees as incorporated into national laws, those recognized in accordance with the UNHCR Statute, individuals granted complementary forms of protection, and those enjoying temporary protection. The refugee population also includes people in refugee-like situations.” ↩︎
- Note that, according to the UNHCR definition, individuals under temporary protection are included in the refugee population. This implies that the Ukrainian crisis in 2022 contributed to the trends shown in Figure 7. ↩︎
- See Figure A.2 in the appendix for country-level details on the refugee population as a share of the total population. ↩︎